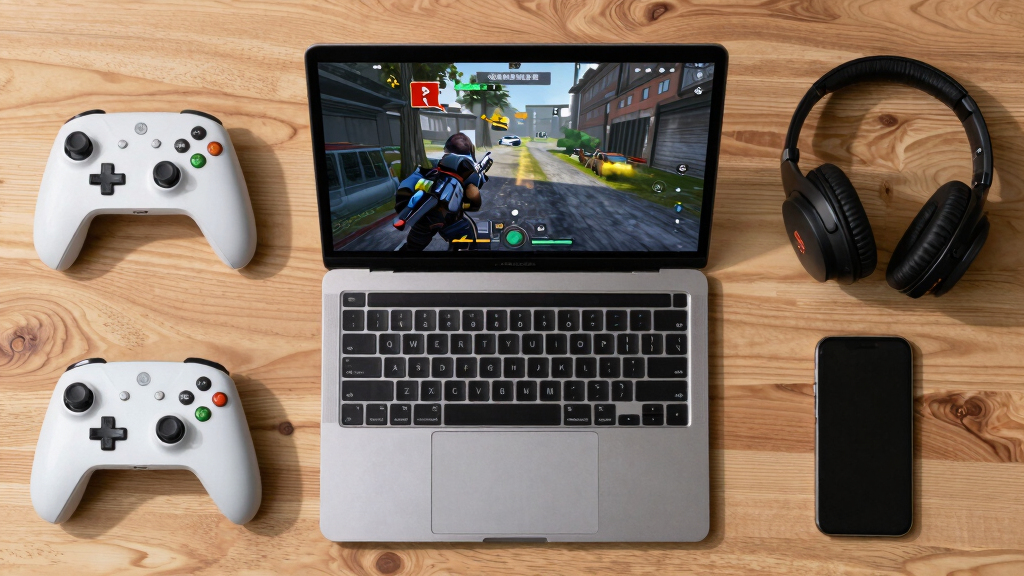

📊 Full opportunity report: Can AI Make Warzone Battles More Visually Stunning? on ThorstenMeyerAI.com — validation score, market gap, and execution plan.

Get business pricing on monitors, keyboards and dev gear
- Business-only prices and quantity discounts
- Tax-exempt purchasing
- Multiple users, one account, clear invoices
TL;DR
AI technology is being used to create real-time, cinematic visualizations of Warzone battles, blending market data with immersive graphics. This development highlights new possibilities for artistic data representation, though its practical impact on gaming remains uncertain.
AI-driven visualizations are now being used to render real-time Bitcoin market activity as a cinematic battlefield, offering a new form of artistic data display. This innovative project, available at war.isbitcoindead.com, employs advanced web technologies to turn market trades into visceral war scenes, making complex data visually engaging. This development highlights how AI and browser-based tech can create immersive, real-time visual experiences, though it is not a gaming or trading tool.
The project, called Bitcoin War, connects directly to cryptocurrency trade streams via WebSocket, visualizing buy and sell orders as combat units on a dynamic battlefield. Large liquidations are represented as airstrikes, while a synthetic soundtrack and live metrics add to the cinematic effect. All visuals are generated client-side using Canvas 2D graphics, WebAudio, and stream processing, with no backend infrastructure required. The system also features an automatic camera that shifts perspectives, providing viewers with a sweeping or detailed view of the ongoing ‘battle.’
According to Thorsten Meyer, the project demonstrates the potential of browser-based AI and web tech to produce artistic, data-driven visualizations that are accessible and engaging. The visualization is purely artistic; it does not provide trading signals or advice, emphasizing its role as an immersive art piece rather than a financial tool.
Implications for Visual Tech and Data Art
This development illustrates how AI and web technologies can be harnessed to create immersive, real-time visualizations of complex data. It opens new avenues for artistic expression, data storytelling, and interactive experiences, potentially influencing future design in gaming, finance, and digital art. However, its practical impact on actual game design or trading remains limited at this stage, as the project is primarily an artistic showcase.
gaming PC with high-end graphics card
As an affiliate, we earn on qualifying purchases.
As an affiliate, we earn on qualifying purchases.
Emerging Use of AI for Data-Driven Visualizations
Recent advances in AI and web technologies have enabled more sophisticated visual representations of data, moving beyond traditional charts to cinematic, interactive displays. Projects like Bitcoin War exemplify this trend by transforming live market data into visceral visual narratives. While similar concepts have been explored in data art and entertainment, this project stands out for its real-time, browser-based implementation that leverages minimal infrastructure.
Historically, visual enhancements in gaming and data visualization have been driven by hardware improvements and software innovation. This project signals a shift toward using AI and web tech for artistic purposes, emphasizing accessibility and immediacy, with no need for specialized hardware or backend servers.
“This project demonstrates the potential of browser-based AI to produce immersive visualizations without backend infrastructure.”
— an anonymous researcher
VR gaming headset for immersive experience
As an affiliate, we earn on qualifying purchases.
As an affiliate, we earn on qualifying purchases.
Practical Impact on Gaming and Data Visualization
It is not yet clear whether AI-driven cinematic visualizations like Bitcoin War will influence mainstream gaming, virtual environments, or trading platforms. The project remains a proof of concept and artistic experiment, with no announced plans for integration into commercial products or games. Its long-term impact on visual design and user engagement in these fields is still uncertain.
real-time game visualization software
As an affiliate, we earn on qualifying purchases.
As an affiliate, we earn on qualifying purchases.
Future Developments in AI and Visual Data Art
Developers and artists may explore further applications of AI in creating real-time, immersive visualizations across various domains, including gaming, finance, and education. Upcoming projects could incorporate interactivity, augmented reality, or deeper AI-driven storytelling. Monitoring how these innovations evolve will clarify whether they transition from artistic experiments to practical tools for engagement and communication.
gaming monitor with cinematic display
As an affiliate, we earn on qualifying purchases.
As an affiliate, we earn on qualifying purchases.
Key Questions
Can this visualization be used for actual trading or gaming?
No, Bitcoin War is purely an artistic visualization that does not provide trading signals or gaming features. Its purpose is to showcase how AI and web tech can create immersive visual narratives from data.
What technologies power Bitcoin War’s visual effects?
The project uses Canvas 2D graphics, WebAudio synthesis, WebSocket data streams, and client-side processing to generate real-time visuals and sound without backend infrastructure.
Is this technology applicable to other data sets or industries?
Yes, similar approaches could be adapted for visualizing other real-time data streams, such as weather, social media, or scientific data, in an immersive, cinematic style.
Will AI-driven visualizations replace traditional data charts?
Currently, these visualizations serve artistic and engagement purposes rather than replacing standard data charts used for analysis and decision-making.
Source: ThorstenMeyerAI.com
Fall Picks
fall essentials
As an affiliate, we earn on qualifying purchases.